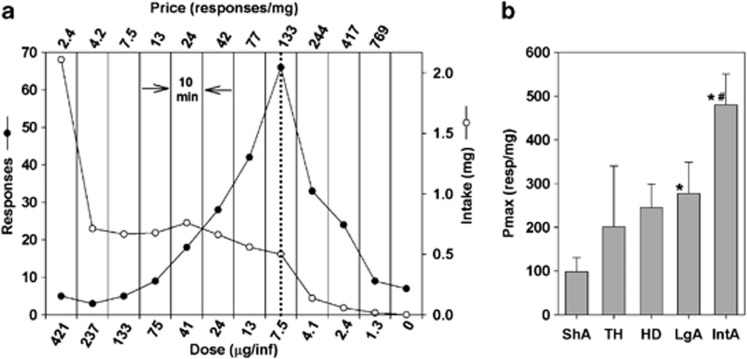
Figure 4.
Behavioral economic analysis of data obtained from the within-session TH procedure. Panel (a) shows a representative animal responding during the TH schedule. Closed circles represent the number of responses emitted during each 10-min bin. Note that the unit dose of cocaine decreased during each bin leading to an increase in responses. Open circles show the intake of cocaine during each bin, demonstrating that total intake of cocaine remained relatively stable through the first 80 min of the schedule despite the rising price of cocaine. The dotted line represents the inflection point (Pmax) at which the animal failed to increase responding to maintain a stable level of intake. The Pmax value was calculated for all animals as the price (responses/mg of cocaine) animals reached before responding dropped off. Average (±SEM) Pmax values are plotted for each group in panel (b). Values statistically higher (p<0.05) than the ShA are denoted by an (*), and values higher than the LgA group are denoted by a pound sign (#).

