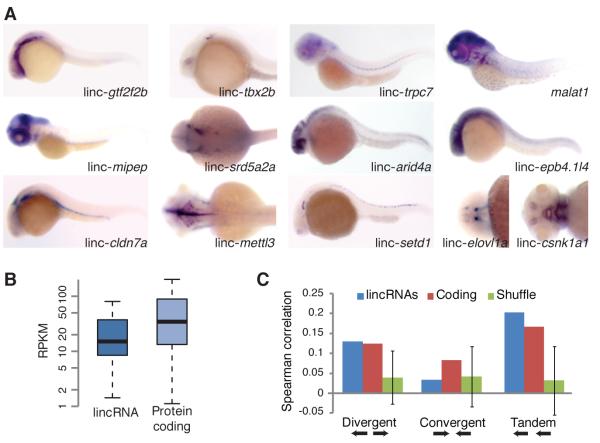
Figure 2. Expression of Zebrafish lincRNAs.
(A) Whole-mount in situ hybridizations of selected lincRNAs. Control experiments using sense probes for selected lincRNAs were also performed (Figure S2).
(B) Expression levels of lincRNA and protein-coding genes evaluated using RNA-Seq results from ten stages/tissues. Plots indicate the median, quartiles, and 10th and 90th percentiles. RPKM is reads per kilobase per million reads.
(C) Correlations between levels of neighboring transcripts. For each gene, the Spearman correlation between its expression profile (across ten stages/tissues) and that of the closest protein-coding gene was determined, and the average is plotted for the lincRNA and coding genes. Error bars are 95% confidence intervals based on 1000 random shuffles of lincRNA positions.

