
Figure 1.
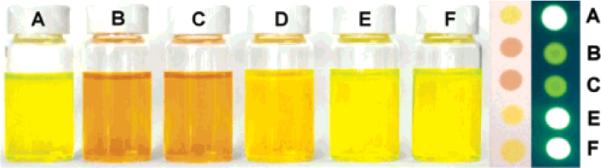
(Left) Color changes of solutions of 1 and various analytes. A, no analyte; B, l-cysteine; C, l-homocysteine; D, bovine serum albumin; E, l-glycine; and F, n-propylamine. (Right) Co-spots of 1 (1.0 × 10⁻³ M) with and without various analytes (1.0 × 10⁻³ M) under visible and UV light.