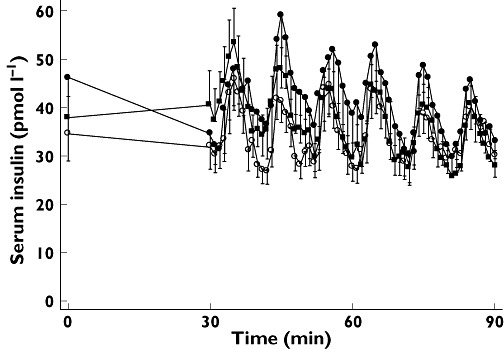
Figure 4.

Glucose stimulated insulin concentration–time series investigations of 10 healthy men receiving CsA ( closed squares), Tac (•closed circles) and saline (○ open circles) infusions. Data are presented as means ± SEM

Glucose stimulated insulin concentration–time series investigations of 10 healthy men receiving CsA ( closed squares), Tac (•closed circles) and saline (○ open circles) infusions. Data are presented as means ± SEM