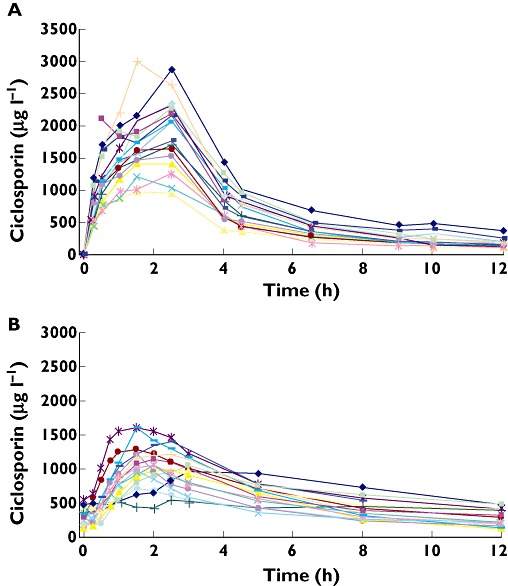
Figure 1.

Individual whole blood concentration– time curves of ciclosporin in patients after stem cell transplantation. (A) after i.v. administration of 2.5 mg kg−1 by infusion over 3 h and (B) after oral administration. Each line represents individual patient data
