Figure 2.

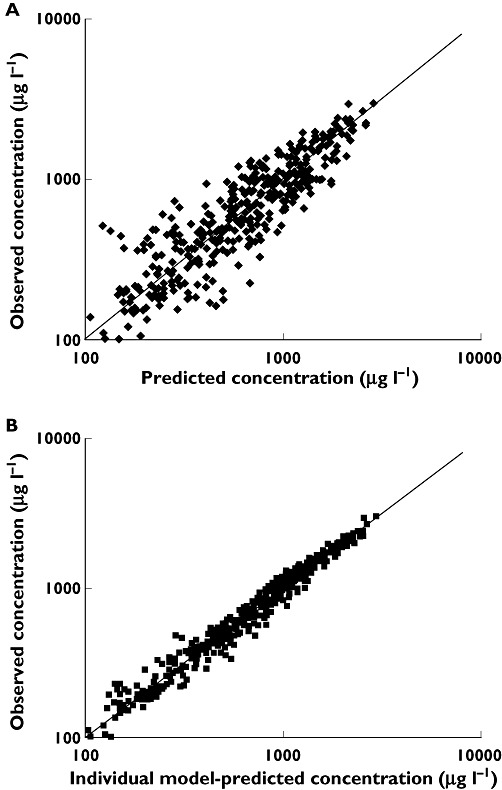
Log-log scatter plots of (A) population model-predicted concentrations (PRED) (µg l−1) vs. observed concentrations (DV) (µg l−1) and (B) individual model-predicted concentrations (IPRED) (µg l−1) vs. DV (µg l−1)

Log-log scatter plots of (A) population model-predicted concentrations (PRED) (µg l−1) vs. observed concentrations (DV) (µg l−1) and (B) individual model-predicted concentrations (IPRED) (µg l−1) vs. DV (µg l−1)