
Figure 2.
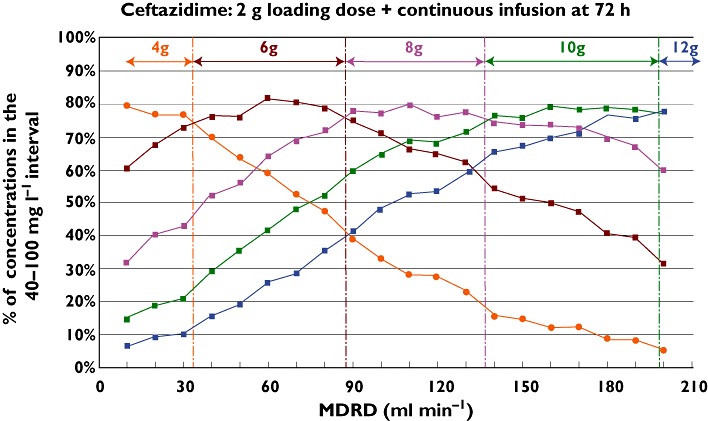
Percentage of simulated patients with 72 h ceftazidime concentrations included in the 40–100 mg l−1 target interval after a 2 g loading dose + different continuous infusion doses as a function of glomerular filtration rate estimated by MDRD in ml min−1 whatever the admitting diagnosis and the mechanical ventilation status. The coloured arrows present the recommended dosage as a function of MDRD. 4 g ( ); 6 g (
 ); 8 g (
 ); 10 g (
 ); 12 g (
 )
)