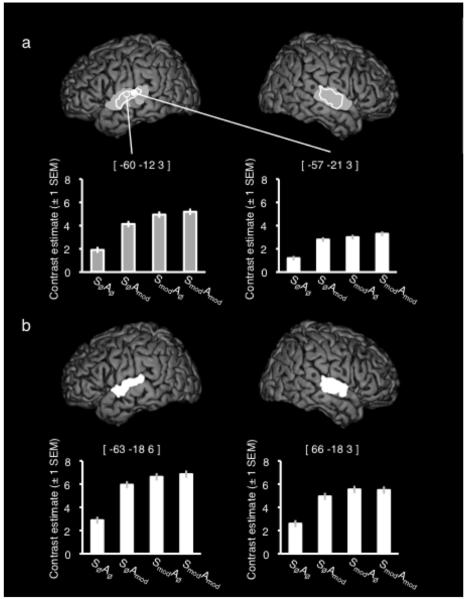
Figure 2.
(a) Activation peaks and extents for the main effect of spectral modulation (Grey) and amplitude modulation (White). Plots show the contrast estimates (± 1 SEM) for each condition taken from the peak voxel in each contrast. (b) Activation extent for the interaction of spectral and amplitude modulation. Plots show the contrast estimates (± 1 SEM) for each condition taken from the peak voxel in each hemisphere. All images are shown at a corrected (family-wise error) height threshold of p < .05 and a cluster extent threshold of 40 voxels. Coordinates are given in Montreal Neurological Institute (MNI) stereotactic space.

