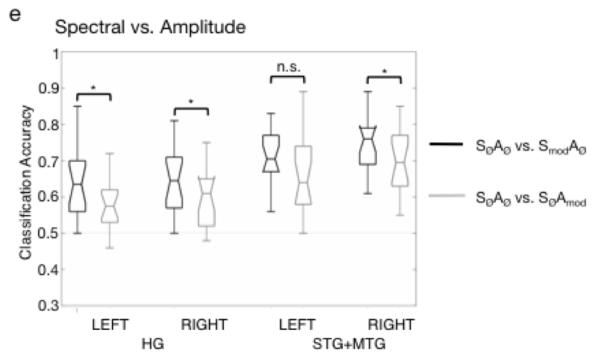
Figure 5.
Box plots of group classification performance on (a) SØAØ vs. SØAmod, (b) SØAØ vs. SmodAØ, (c) SØAØ vs. SmodAmod (d) Spectral vs Amplitude classification (i.e. (SØAØ vs. SmodAØ) versus (SØAØ vs. SØAmod) in each of the anatomically-defined regions-of-interest (ROIs). Annotations indicate the result of pairwise comparisons (paired, two-sided Wilcoxon signed rank tests) of performance in left and right ROIs (a-c, e) and within-ROI (d). * = significant at a corrected level of p < .017 (a-c, e) or p < .013 (d), HG = Heschl’s gyrus, STG+MTG = combined superior temporal gyrus and middle temporal gyrus, IOG = inferior occipital gyrus, L = left hemisphere, R = right hemisphere.

