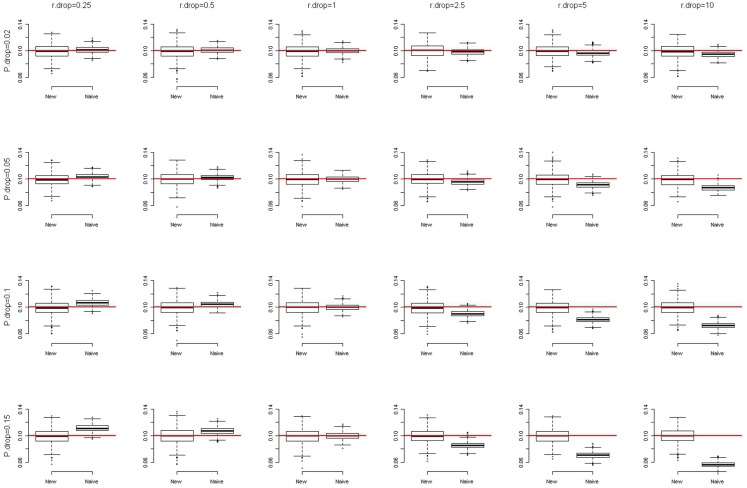
Figure 1.
The box-and-whiskers plots of 1,000 estimates of MAF, given MAF = 0.1. The different panels in the figure are arranged so that the overall genotype missing rate (P.drop) is 0.02, 0.05, 0.1, and 0.15 (from top to bottom) and the DDR (r.drop) is 0.25, 0.5, 1, 2.5, 5, and 10 (from left to right). A box is constructed with a median (here, very close to the mean) and two quartiles (the first and the third quartiles). The outliers are data points outside the range of (first quartile −1.5 × IQR, third quartile +1.5 × IQR), where IQR is the inter-quartile range (third quartile − first quartile). The end of the upper whisker is the largest data point below the third quartile +1.5 × IQR, while the end of the lower whisker is the smallest data point beyond the first quartile −1.5 × IQR.

