
Figure 2.
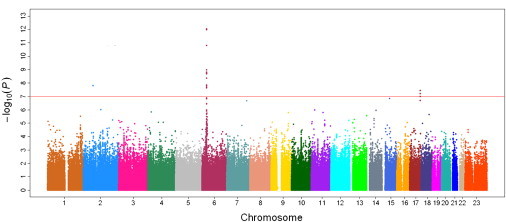
Manhattan Plot of Genome-wide Association Analyses for Nonobstrusive Azoospermia
The x axis shows chromosomal positions. The y axis shows –log10 p values from allelic tests adjusted for age and first principal component from a population stratification analysis. The horizontal dashed line indicates the preset threshold of p = 1 × 10⁻⁵. The horizontal solid line indicates the preset threshold of genome-wide significance: p = 5 × 10⁻⁸.