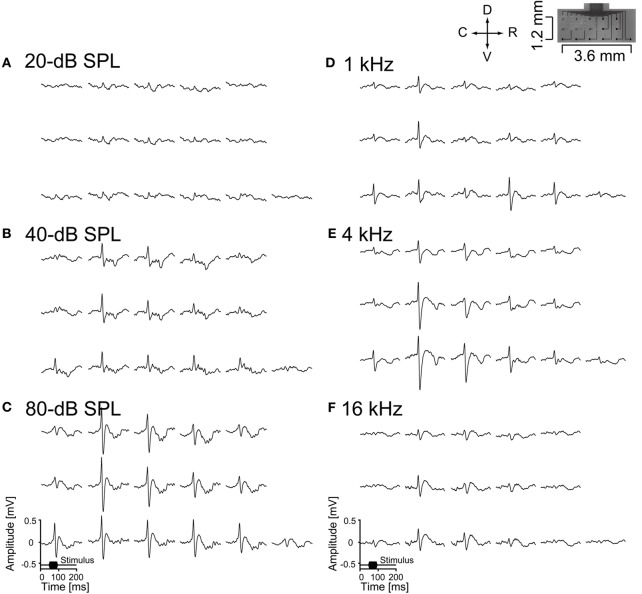
Figure 6.
Auditory evoked potentials recorded from the auditory cortex of an anesthetized rat by the ECoG electrode. The data shown here are averages across 100 stimulus presentations. (A-C) Auditory stimuli were 50 ms broadband noise at 20-, 40-, and 80-dB SPL, and (D-F) 50 ms pure tones of 1, 4, and 16 kHz at 80-dB SPL (D-F). Each set of data represent the same alignment as that in the right-top picture, which shows the alignment of 16-channel recording microelectrodes.

