
. 2012 Apr 27;14(2):e60. doi: 10.2196/jmir.1969
©Michael Stellefson, Bruce Hanik, J. Don Chaney, Bethany Tennant. Originally published in the Journal of Medical Internet Research (http://www.jmir.org), 27.04.2012.
This is an open-access article distributed under the terms of the Creative Commons Attribution License (http://creativecommons.org/licenses/by/2.0/), which permits unrestricted use, distribution, and reproduction in any medium, provided the original work, first published in the Journal of Medical Internet Research, is properly cited. The complete bibliographic information, a link to the original publication on http://www.jmir.org/, as well as this copyright and license information must be included.
Figure 1.
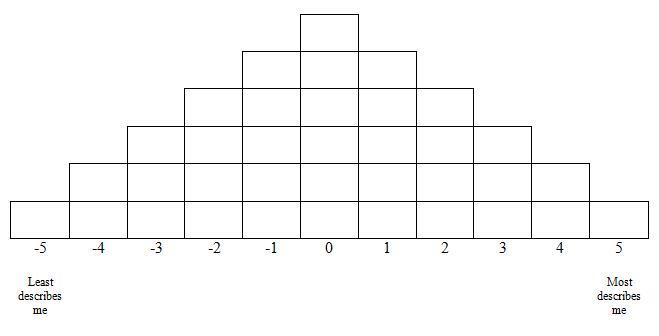
Final distribution of Q sort procedure (Q sort table).