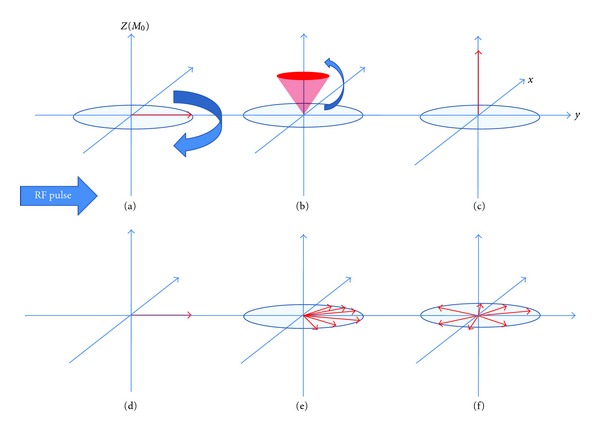
Figure 2.

Schematic of T 1 and T 2 relaxation. MRI utilises the behaviour of protons within varying magnetic fields to produce signals which can be converted into images. Each hydrogen nucleus in the brain can be thought of as a vector (in the z and x-y planes) representing the strength and direction of its magnetic field as it spins on its axis (its magnetic dipole moment, MDM). The MDMs of the imaged protons try to align with the main external magnetic field of the scanner (referred to here as B 0 and conventionally shown along the z axis in 3D coordinates). A second magnetic field (in the form of a short radiofrequency RF pulse) is applied, which flips all of the MDMs from alignment in the z direction into the x-y plane (a). Before application of the RF pulse the, amplitude in the z-axis is maximal while the amplitude in the x-y plane is zero. Just after application of the RF pulse the, amplitude in the z-axis is zero (a) while the amplitude in the x-y plane is maximal (d). During relaxation, the amplitude in the z-axis will slowly increase ((b) and (d)) while the amplitude in the x-y plane slowly decreases ((e) and (f)). T 1 relaxation is the time taken for the z vector to regain in strength, whereas T 2 relaxation is the time taken for the x-y vector to decay. These changing magnetic vectors invoke their own RF signals, which are picked up by the receiver coils and interpreted into information about the proton density of the subject being scanned.
