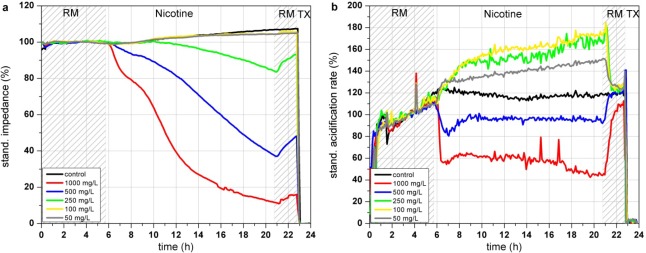
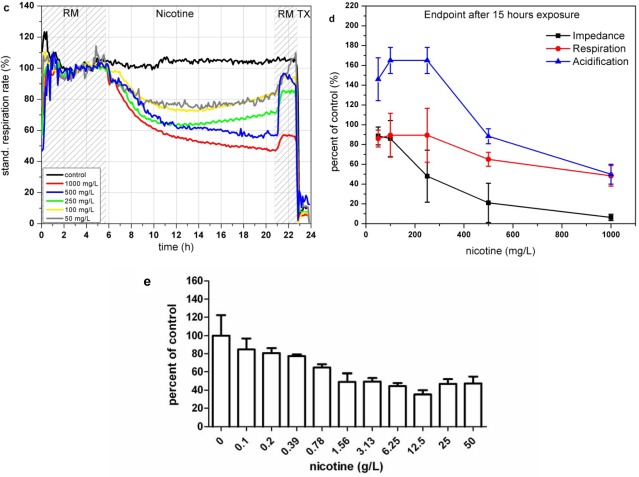
Figure 7.
Time course of the impedance (a), acidification (b) and respiration (c) of L6 rat skeletal muscle cells during 24 h incubation with nicotine in the Bionas 2500 Analyzing System. Vehicle control (black), 1,000 mg/L (red), 500 mg/L (blue), 250 mg/L (green), 100 mg/L (yellow). Phases with running medium (RM) represent culture medium treatment without added substances. (d) Percent of control of impedance, respiration and acidification endpoint values measured after 15 h of nicotine exposure (n = 3). (e) Results of BrdU assay of L6 cells incubated with nicotine for 24 h.


