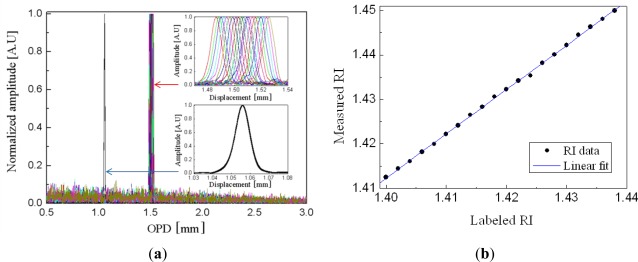
Figure 3.
(a) Fourier spectra of the fabricated FPI fiber sensor measured with liquid (upper inset) and without liquid (lower inset) at the cavity, and (b) the RI of the liquid calculated from the Fourier spectrum and plotted with respect to the labeled RI. A series of liquid solutions of RIs from 1.400 to 1.438 with a step of 0.002 were applied into the cavity [35].

