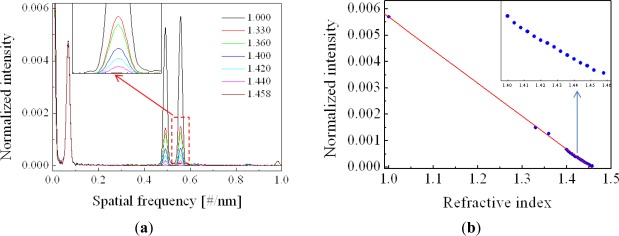
Figure 5.
(a) Fourier spectra measured with air (black curve) and several RI solutions (color curve). Inset is the magnified image of the red dotted region; (b) Intensity variation of the third Fourier peak plotted with respect to the labeled RI of the solutions [38].

