
Figure 2.
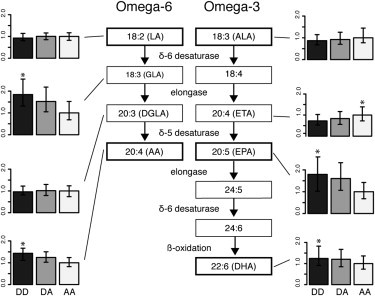
Effect of Haplotype on Synthesis of PUFAs in the Omega-3 and Omega-6 Pathways
Measurements of the omega-3 and 6 fatty-acid levels in the NSPHS population. The three bars in each of the smaller plots (labeled DD, DA, and AA) represent levels of fatty acids in individuals homozygous (AA and DD) and heterozygous (DA) for the A and D haplotypes. Fatty-acid measurements have been scaled so that the average levels for the individuals homozygous for haplotype A are set to 1. The error bars represent the upper and lower quartiles for the PUFA measurements. Asterisks (∗) indicate p values < 10−3.