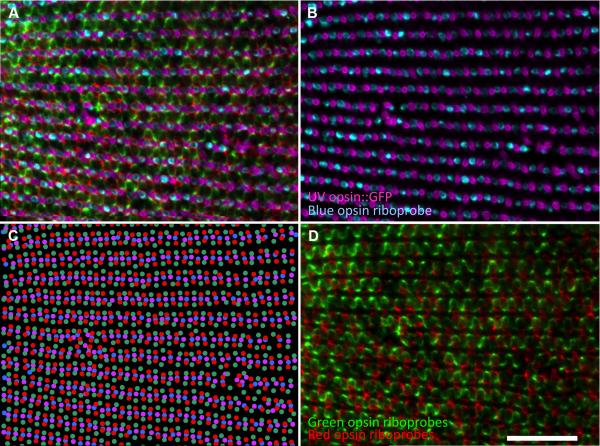
Figure 2.
Cone photoreceptor subtype positions in a retina from an adult zebrafish determined by markers for opsin expression. A. Triple-label multiplex in situ hybridization using riboprobes against blue-, green- and red-sensitive opsins on a transgenic retina expressing GFP in UV-sensitive cones. Fluorescent signals are pseudo-coloured cyan, green, red and magenta, respectively. Panel B is the same field as A with only UV and B channels; D is the same field as A with only the G and R channels. C. Excel plot of experimental data presented in panel A. Note the central retina (i.e., optic nerve head) is to the left in this image and the retinal periphery is to the right, such that the rows of cones are slightly further apart towards the periphery. Panel C and D are replicated as Supplemental Figure in magenta-green. Scale bar represents 50 μm.

