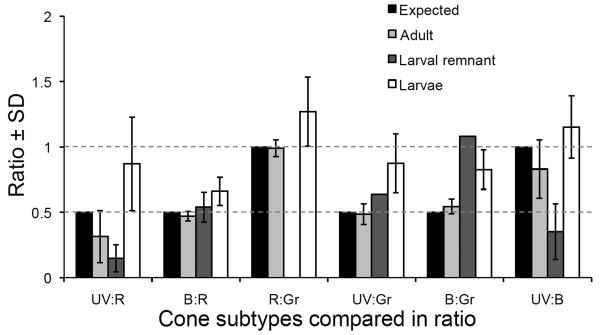
Figure 3.
Ratios of cone photoreceptor subtypes in various stages of zebrafish development. The canonical row mosaic of adult zebrafish predicts ratios of cones (black bars and dotted lines, e.g. see Figure 1). The ratios observed in adults are not significantly different from expected (χ2, p> 0.05). Cone ratios in larvae are significantly different from expected (χ2, p< 0.03), with an excess of UV cones relative to other types, and an excess of B cones relative to R or G cones compared to that expected from the canonical row mosaic. Cone ratios within the region of retina surrounding the optic nerve head that was generated during larval development (the larval remnant) are also different from expected (χ2, p< 0.03). See also Table 1. Data is represented as ratios ± standard deviation.

