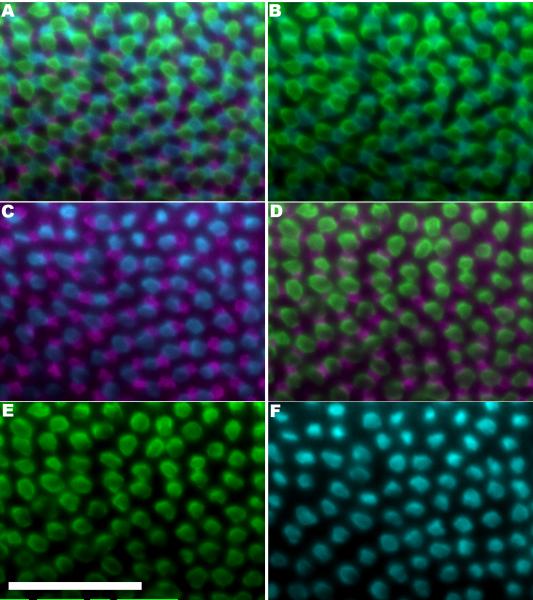
Figure 4.
Cone photoreceptor subtype positions in a retina from a larval zebrafish (four days post-fertilization) determined by markers for opsin expression. A. Double-label in situ hybridization using riboprobes against blue- and greensensitive opsins on a transgenic retina expressing GFP in UV-sensitive cones. Fluorescent signals are pseudo-coloured cyan, green, and magenta, respectively. The areas not occupied by fluorescent signal can be expected to predominantly contain red-sensitive cones and a few rods (data not shown). Panels B thru F are the same field as A, with only subsets of the channels displayed. Panel B displays B and G channels; Panel C displays UV and B channels; Panel D displays UV and G channels; Panel E displays the G channel; Panel F displays the B channel. Figure 4 is replicated as the Supplemental Figure 2 with the same data represented in magentagreen. Scale bar represents 50 μm.

