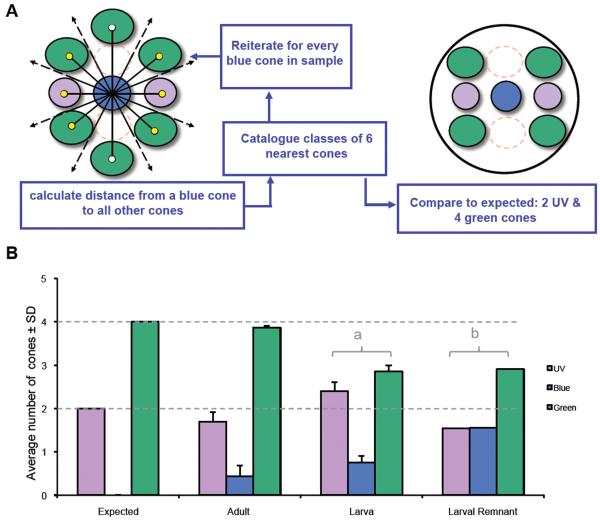
Figure 5.
The mosaic metric index reveals local cone patterns in adult retinas consistent with the canonical row pattern, whereas larval retinas show more variability. A. The mosaic metric catalogues the identity of the six cones closest to each B cone in the sample by first finding the distance from a B cone to every cone (lines with empty circles or arrowheads) and indentifying the six closest cones (yellow circles). This is then reiterated for every B cone and data is compiled for comparison to expected values. The samples are labelled for B, UV and G cones only, thus R cones are represented by dashed circles. For the canonical row mosaic we expect the result to be 2 UV cones, 0 B cones and 4 G cones. B. Mosaic metric analysis: Cone patterns in adult retinas are not significantly different from expected (χ2, p>0.25; 17 images from n=3 fish). Cone patterns in a larval retina are significantly different from expected (χ2, p<0.025, n= 6 fish; labeled on figure by ‘a’). Cone patterns in a remnant of larval retina retained in the adult (n=149 blue cones in one retina) are also significantly different from expected (χ2, p<0.0001, noted on figure by ‘b’), although the nature of the difference is distinct in the larvae and larval remnant. Dotted lines note expected values, which are also indicated by the data set on the left of the graph.

