
Figure 1.
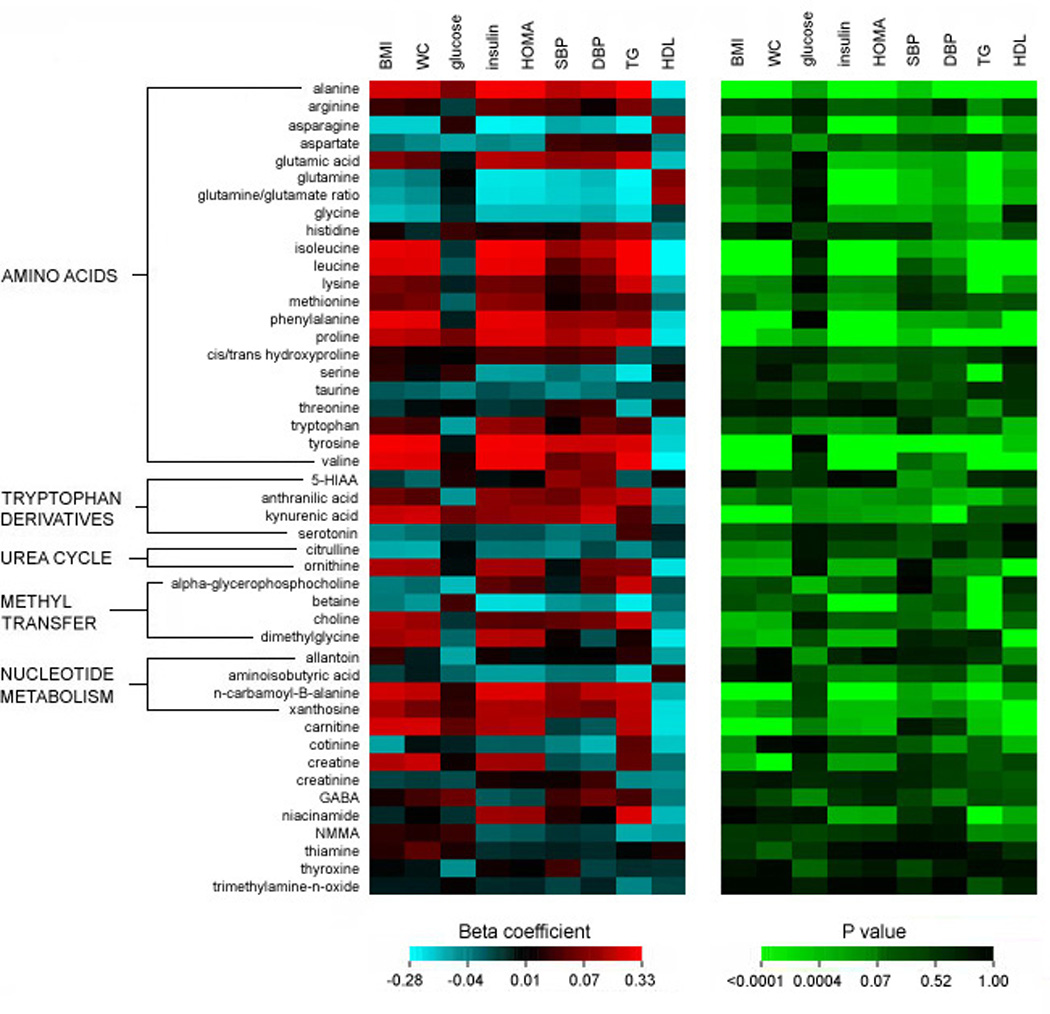
Beta coefficient and P values generated from age- and sex-adjusted regression analyses of the relation of each metabolite (standardized and log transformed) with insulin resistance phenotypes and metabolic traits (standardized) in the FHS sample.