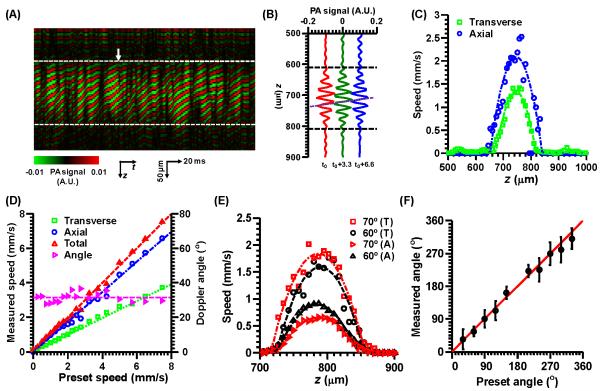
Figure 2.
Total flow measurement on bovine blood flowing in a plastic tube (diameter: 200 μm). (A) An M-mode image of the tube with a Doppler angle of 30° and mean total flow speed of 1.25 mm/s after passing through a digital filter. The dashed lines indicate the top and bottom boundaries of the tube. (B) Three representative consecutive A-lines with a time interval of 3.3 ms, where t0 is indicated by the arrow in (A). The horizontal dashed lines indicate the top and bottom boundaries of the tube. The oblique dashed line shows the phase shifts among these A-lines. (C) Transverse and axial speed profiles from (A). (D) Measured transverse, axial, total flow speeds as well as the Doppler angle versus the preset total flow speed. (E) Measured axial and transverse flow speed profiles, with the same total flow speed (mean: 1.0 mm/s) but different Doppler angles (60° and 70°). T, transverse; A, axial. (F) Measured Doppler angle as a function of the preset value. Error bars: standard deviations.

