Figure 3.
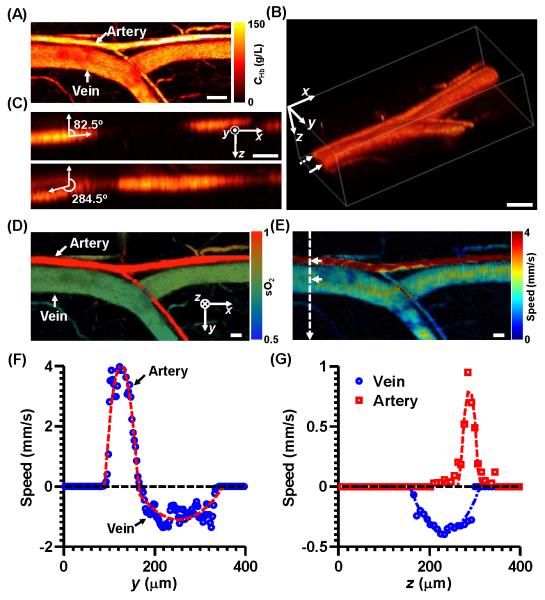
Multi-parametric PAM of a mouse ear. Scale bar: 100 μm. (A) Maximum amplitude projection of the total hemoglobin concentration image of an artery-vein pair in the mouse ear. CHb: total hemoglobin concentration. (B) Volumetric rendering of the same area as in (A). (C) Sagittal cross-section images of the artery (top) and vein (bottom), indicated by the dashed and solid arrows in (B), respectively. (D) sO2 image of the same area. (E) Total flow speed image of the same area. (F) Transverse speed profiles along the dashed line in (E). Positive transverse flow direction: from left to right. (G) Axial speed profiles along the depth direction at the centers of the artery and vein, indicated by the arrows in (E). Positive axial flow direction: towards the ultrasonic transducer.

