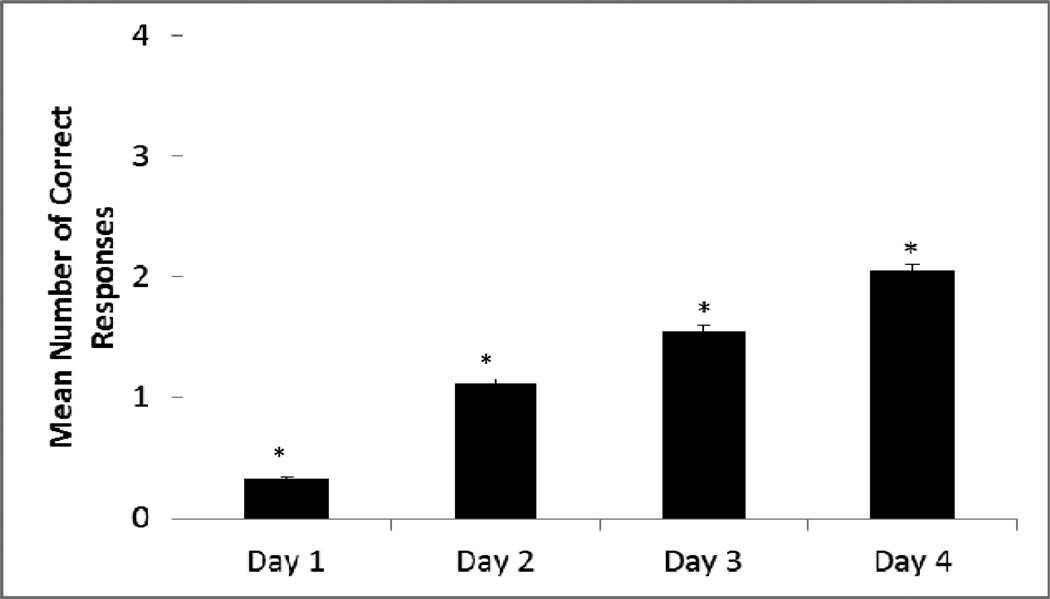
Figure 2.
Estimated marginal means for the number of correct responses to production probes each day of the study (maximum possible = 4). Error bars represent standard errors. * indicates means are significantly different at p < .001. Scores for each day were significantly higher than the preceding day.

