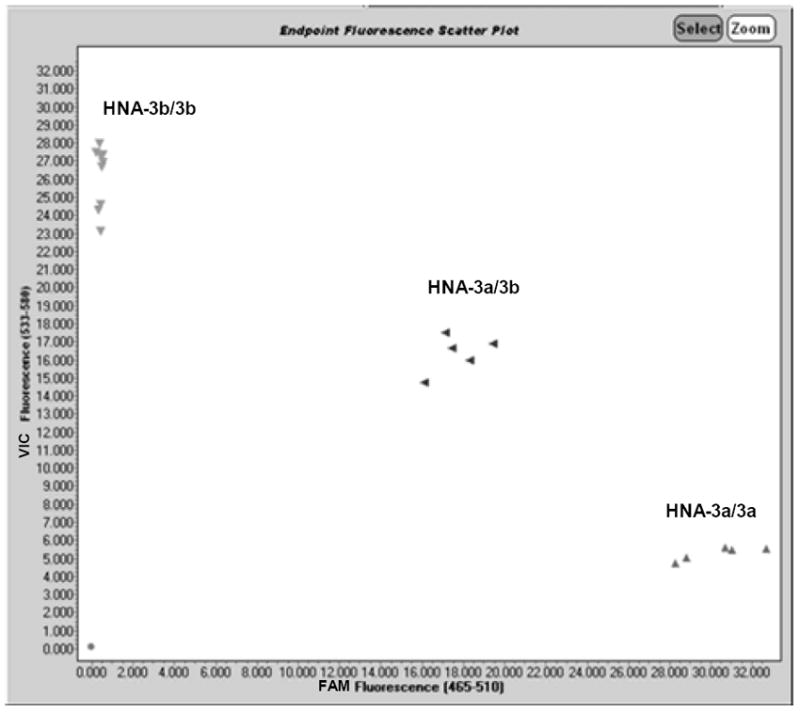
Figure 1. FAM/VIC fluorescence (FL) plot of HNA-3a/HNA-3b genotyping results using the SNP genotyping assay (SGA).

The assay employed TaqMan® 5’ exonuclease chemistry and real-time PCR amplification of genomic DNA with specific primers and detection of amplicons with allele-specific fluorescence (FL) hydrolysis probes, and FAM/VIC fluorescence scatter plots generated by instrument software as described in materials and methods. HNA-3 genotype results are shown for 16 normal blood donors and 3 control samples consisting of HNA-3a/3a (triangles, lower right plot area), HNA-3a/3b (triangles, middle plot area), and HNA-3b/3b genotypes (triangles, upper left plot area). Some FL values were identical resulting in overlap of data points in the HNA-3b/3b genotype area of the plot.
