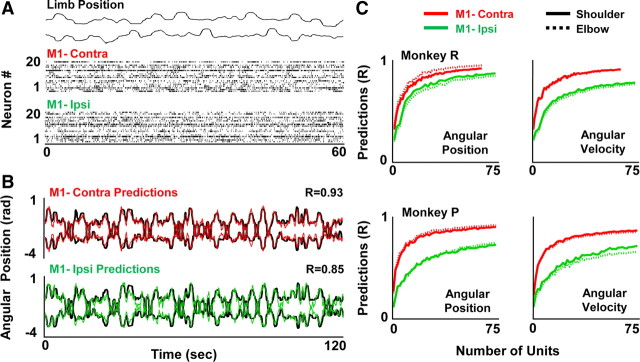
Figure 2.
Real- time decoding of ipsilateral upper limb parameters from M1 spike activity. A, Continuous illustration of shoulder (top) and elbow (bottom) angular position and spiking data from each hemisphere. Each dot represents a single spike. B, Predictions of elbow and shoulder position from ensembles of ipsilateral and contralateral spike activity. Dark traces show the movements across time. Whereas the red trace shows the prediction from contralateral M1, the green trace shows that for ipsilateral M1. R is the correlation between the predicted and the actual traces. C, Neuron-dropping curves to illustrate the relationship between ensemble size and predictive ability for both angular position and velocity for Monkey P and R. Dotted line (shoulder), Solid line (elbow).

