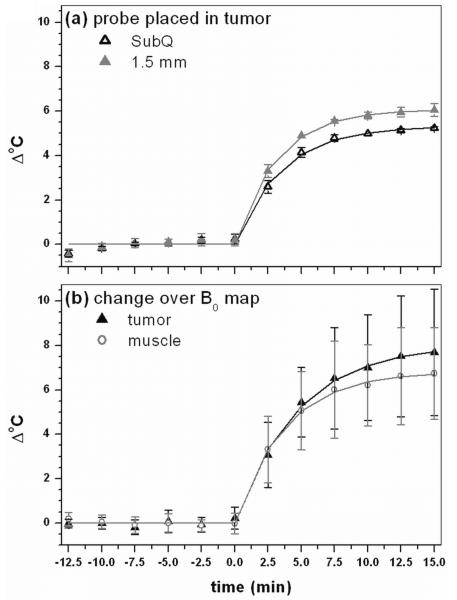
Figure 2.
(a) Average result of bench experiment with the temperature needle probe placed subcutaneously (SubQ) and 1.5 mm in the tumor tissue and (b) average change over all experiments in temperature in B0 maps in tumor and muscle. Points indicate real data whereas solid lines indicate respective fits by equation (1) to data. All fits have a R2 value greater than 0.995, indicating that equation (1) models the change in temperature using needle probes and the temperature dependent change in proton resonance frequency shifts very well.

