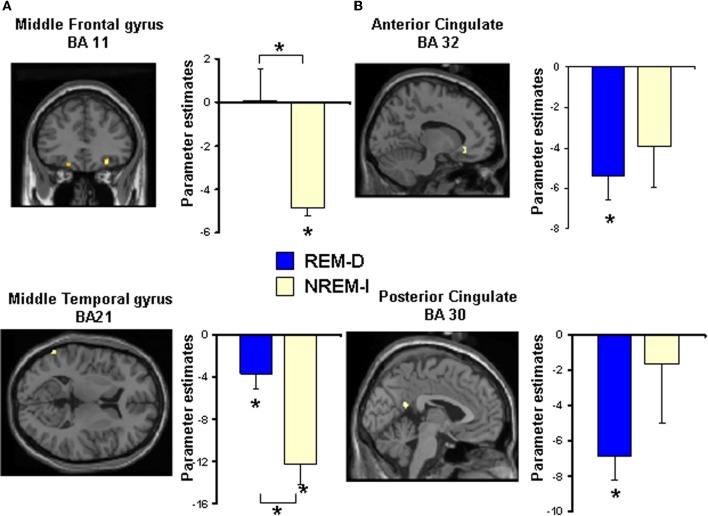
Figure 5.
Statistical maps for some of the regions showing significant differences in activation during performance of the Emotional Reactivity Task (high + low emotional reactivity trials) after (A) non-REM sleep interruptions (NREM-I) and (B) REM sleep deprivation (REM-D), relative to baseline sleep. Maps are thresholded at p < 0.001 (uncorrected). See Table 3 for all significant activations. Bar graphs show the corresponding differences in activation between baseline and experimental night for the REM sleep deprivation and non-REM sleep interruption groups. Coordinates are in MNI space. Asterisks above brackets indicate significant post-hoc differences between groups whereas asterisks above individual bars represent significant differences from zero (p < 0.05).

