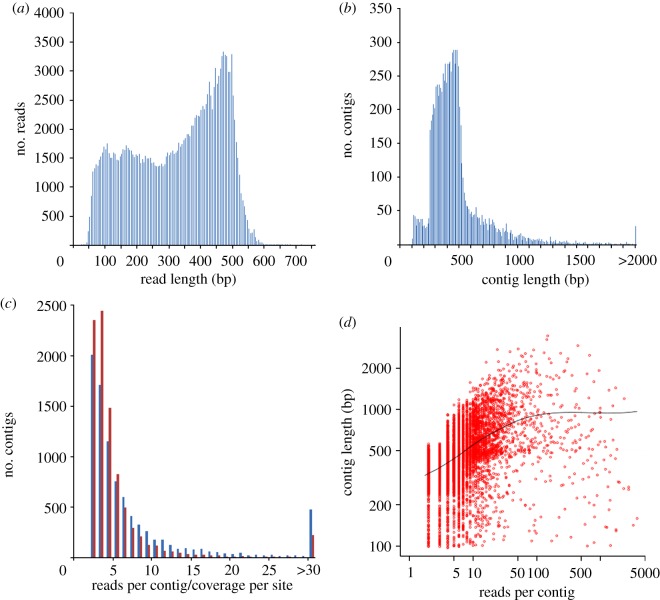
Figure 1.
A summary of sequencing and contig assembly results. (a) Length distribution of the pre-process 454 quality-filter-pass reads. (b) Length distribution of assembled contigs. Contigs larger than 2000 bp are binned at the end of the x-axis. (c) Distribution of reads per contig (blue) and coverage per nucleotide site (red). Contigs with more than 30 reads are binned at the end of the x-axis. (d) Density scatterplot showing relationship between reads per contig and contig length. The black line represents the trend of the contig length with increasing reads per contig. Both the x- and y-axes are presented on a log scale.

