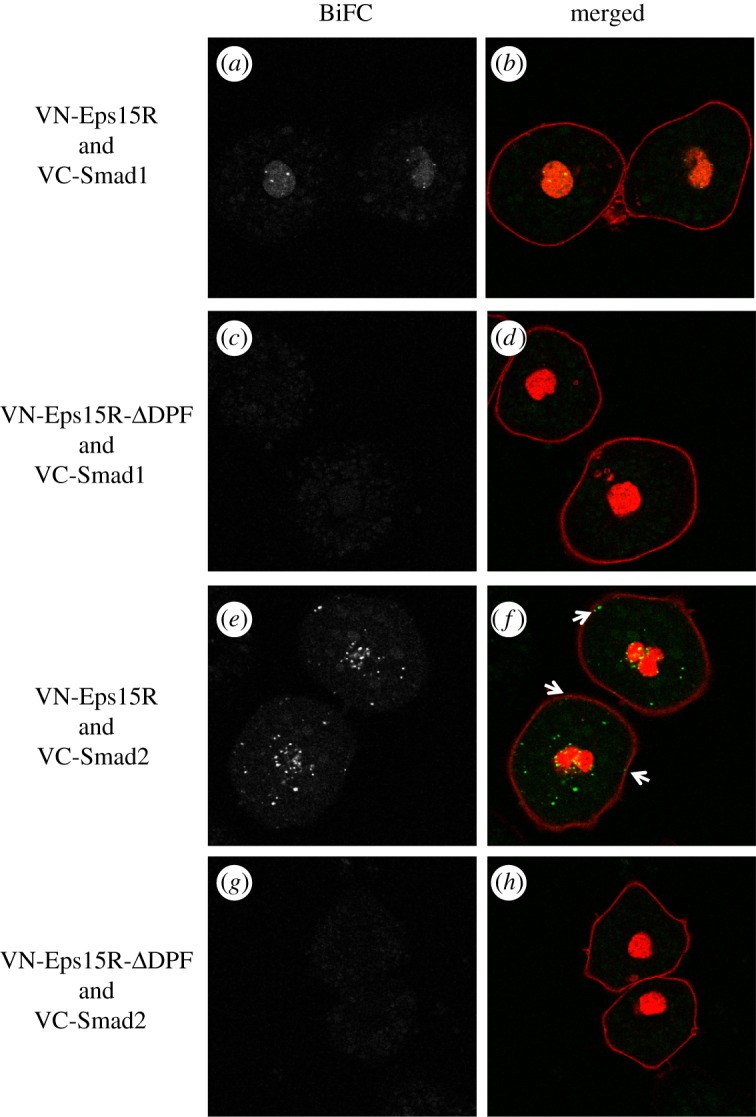
Figure 4.

Differential compartmentalization of Eps15R/Smad complexes. Live imaging of Eps15R/Smad complexes monitored by bimolecular fluorescence complementation (BiFC). (a,c,e,g) Greyscale images of BiFC fluorescence. (b,d,f,h) Merged images of BiFC fluorescence in green and CFP-histone H2B (to label nucleus) and CFP-GPI (to label membranes) in red. Total numbers of cells scored for each BiFC complex were: n = 78 (Eps15R/Smad1); n = 27 (Eps15R-ΔDPF /Smad1); n = 45 (Eps15R/Smad2); n = 24 (Eps15R-ΔDPF/Smad2). (a,b) Cells injected with VN-Eps15R and VC-Smad1 have nuclear BiFC fluorescence, with enrichment in localized regions. (c,d) VN-Eps15R-ΔDPF does not interact with VC-Smad1. (e,f) Complexes of VN-Eps15R and VC-Smad2 are distributed in punctate dots throughout the cell. Some complexes are closely associated with the membrane (arrows), consistent with the known association of Eps15R with coated pits. (g,h) VN-Eps15R-ΔDPF does not interact with VC-Smad2.
