Figure 1.
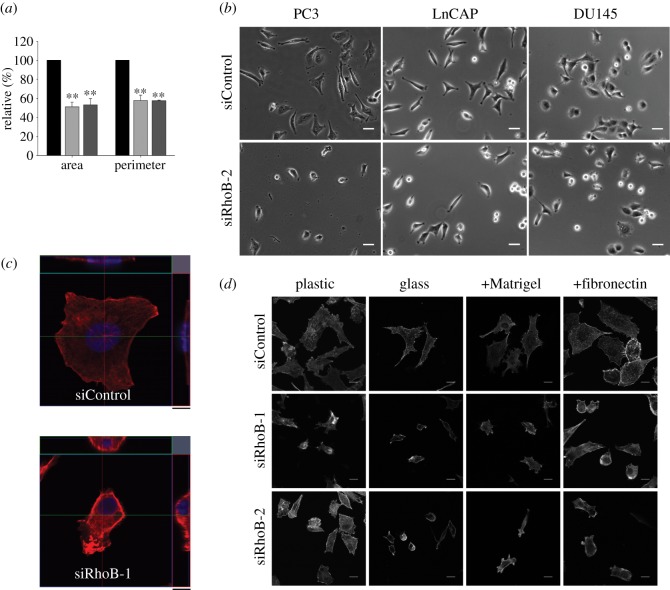
RhoB affects cell morphology. (a) Quantification of cell area and cell perimeter of siRNA-transfected PC3 cells (mean ± s.d. from four different experiments and >200 cells). Black bars denote siControl; light grey bars denote siRhoB-1; dark grey bars denote siRhoB-2. Values are shown relative to siControl (**p < 0.01). (b) Phase-contrast images of RhoB-depleted or control cells from the indicated cell lines. Scale bars, 40 µm. (c) Orthogonal view of a representative siControl or siRhoB-treated cell. Scale bars, z = 9.5 µm. (d) F-actin distribution in siRNA-transfected PC3 cells plated on uncoated plastic or glass, or plastic coated with Matrigel or fibronectin. Scale bars, 20 µm.

