Figure 4.
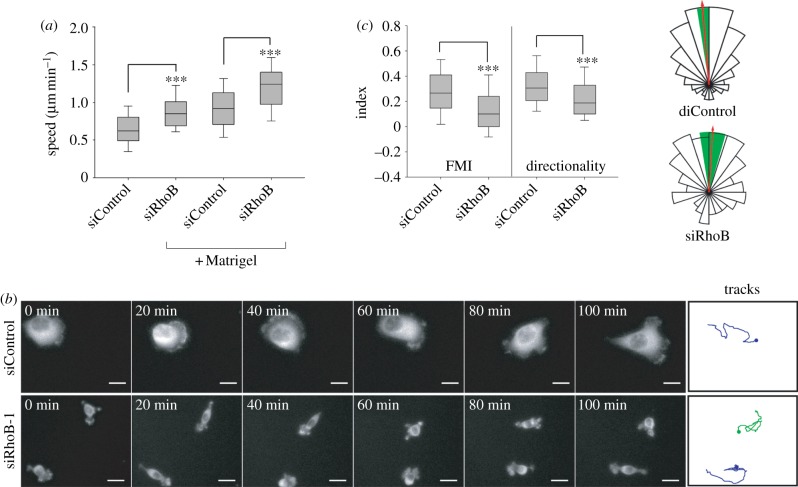
RhoB affects cell migration speed and directionality. (a) Migration speed of siRNA-transfected PC3 cells on tissue culture-treated plastic. n > 50 cells per condition from three different experiments. Results with two different siRNAs for RhoB and two siControl oligos are pooled; cells were tracked for 12–14 h, 58–60 h after transfection. (b) Montage from the electronic supplementary material, movie S3 showing representative GFP-actin-expressing PC3 cells. Tracks panels (right) show movement of the shown cells over time. Scale bars, 20 µm. (c) Forward migration index (FMI) and directionality of siRNA-transfected PC3 cells in a chemotaxis assay. n > 200 cells per condition from four different experiments using two different siRNAs for RhoB and two siControl oligos. Boxes of box and whisker plots show median, 25th and 75th percentile; whiskers show 95th percentile; ***p < 0.001. Rose plots show the proportion of cells with a migration direction lying within each 20° interval. Red arrow represents mean direction of cell migration; green segment, 95% CI.

