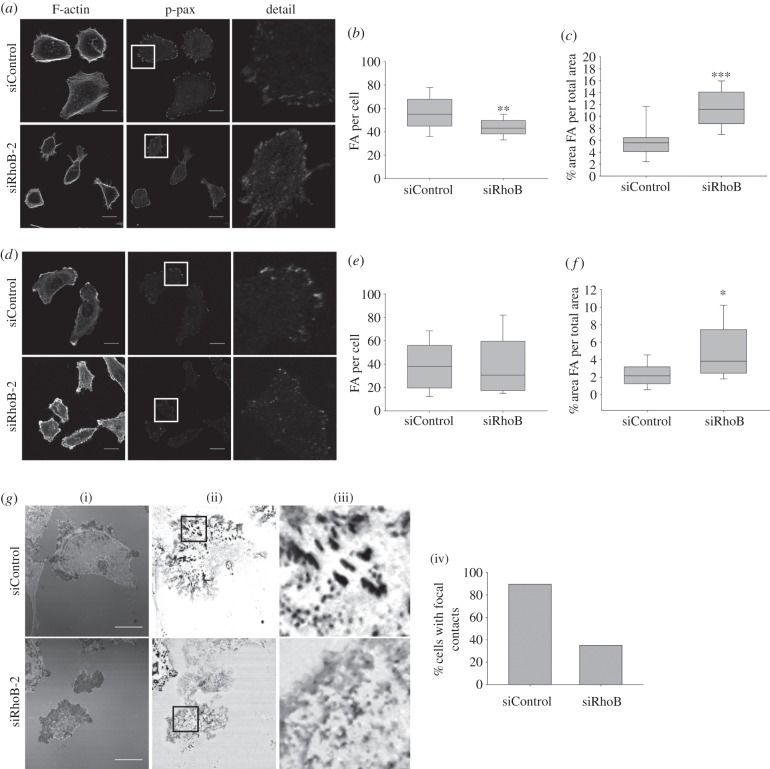
Figure 7.
RhoB regulates focal adhesion dynamics. (a) Serum-starved PC3 cells stimulated with 10% FCS for 1 h to promote spreading were stained for F-actin and with antibodies to phospho-paxillin to show focal adhesions and focal complexes. Boxed regions (middle panels) are shown at higher magnification in the right panels. (b,c) Graphs show the number of phospho-paxillin-positive focal adhesions/focal complexes (FA) per cell or area occupied by FA relative to the total spread area. (d) PC3 cells under normal migratory conditions (1% FCS) were stained for F-actin and with antibodies to phospho-paxillin to show FA. Boxed regions (middle panels) are shown at higher magnification in the right panels. (e,f) Number of phospho-paxillin-positive FA per cell or area occupied by FA relative to the total spread area in normal migratory conditions. Results in graphs are from at least 10 cells from two different experiments. Boxes of box and whisker plots show median, 25th and 75th percentile; whiskers show 95th percentile; ***p < 0.001, **p < 0.01, *p < 0.05. (g) (i) Representative interference reflection microscopy images of PC3 cells after siRNA transfection. (ii) Dynamics images show a thresholded maximal projection of the same cells over 70 frames (15 s frame−1). (iii) Detail: enlargement of boxed regions in (ii). (iv) Graph shows percentage of cells with stable focal contacts in interference reflection microscopy movies; n > 20 cells per condition. (a,d,g) Scale bars, 20 µm.

