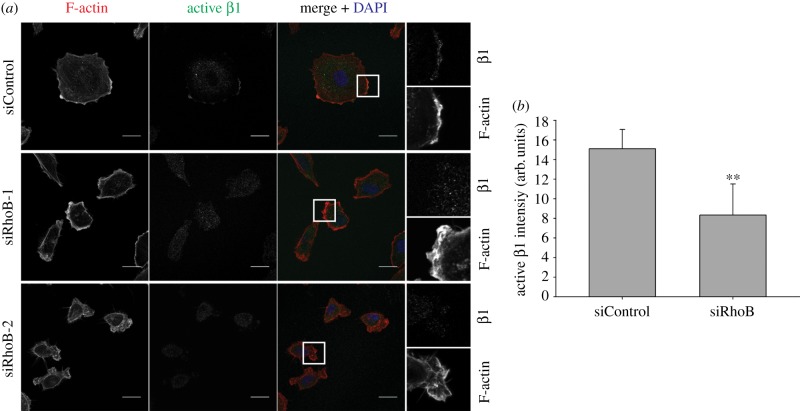
Figure 8.
RhoB affects β1 integrin activity in protrusions. (a) Confocal images showing active β1 integrin staining and F-actin. Boxed regions (merge panels) are shown at higher magnification in the right panels. Scale bars, 20 µm. (b) Quantification of active β1 integrin intensity in protrusions. Arb. units denotes arbitrary units. n = 18 cells from two different experiments; **p < 0.01.

