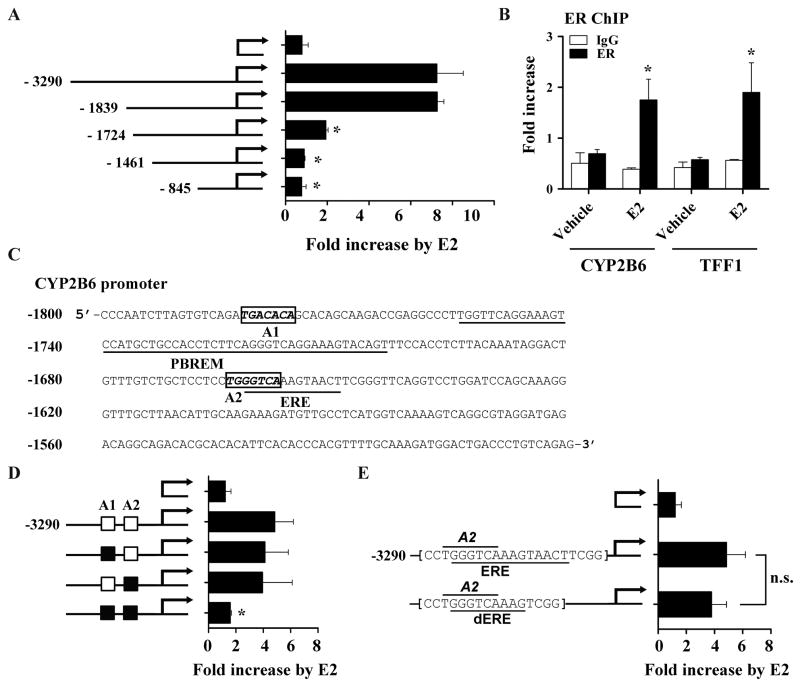
Fig. 4.
Putative AP-1 binding sites are potentially responsible for CYP2B6 induction by E2 in HepG2 cells. (A) HepG2 cells were co-transfected with a 5′-deletion construct of pGL3-CYP2B6 (or pGL3-basic), ER expression plasmid, and β-galactosidase expression vector. The transfected HepG2 cells were treated with ethanol or E2 (1 μM) for 24 hr, and luciferase assay was performed. (B) HepG2-ER cells were treated with E2 for 45 min. ChIP assays were carried out using rabbit IgG or an antibody against ER, and the amount of ER-bound DNA in CYP2B6 or TFF1 upstream regions was examined by qRT-PCR. For CYP2B6, a primer set that amplifies −1803/−1729 of the gene was used (supplemental Table 1). (C) Putative AP-1 binding sites (A1 and A2), PBREM [13], and ERE [32] within −1800/−1500 upstream region of CYP2B6 are shown. NCBI reference sequence NG_007929.1 was used. (D) HepG2 cells were co-transfected with pGL3-CYP2B6 harboring mutations in A1 and/or A2 (represented by a black box), ER expression plasmid, and β-galactosidase expression plasmid. The transfected cells were treated with vehicle (ethanol) or E2 (1 μM), and luciferase assay was performed. (E) HepG2 cells were transfected with pGL3-CYP2B6 harboring a deletion of part of a putative ERE (i.e., dERE) or wild type sequences. The transfected cells were treated with ethanol or E2 (1 μM), and luciferase assay was performed. Results shown are fold increases in CYP2B6 promoter activity by E2-treatment. n.s., statistically not significant.

