
Figure 1.
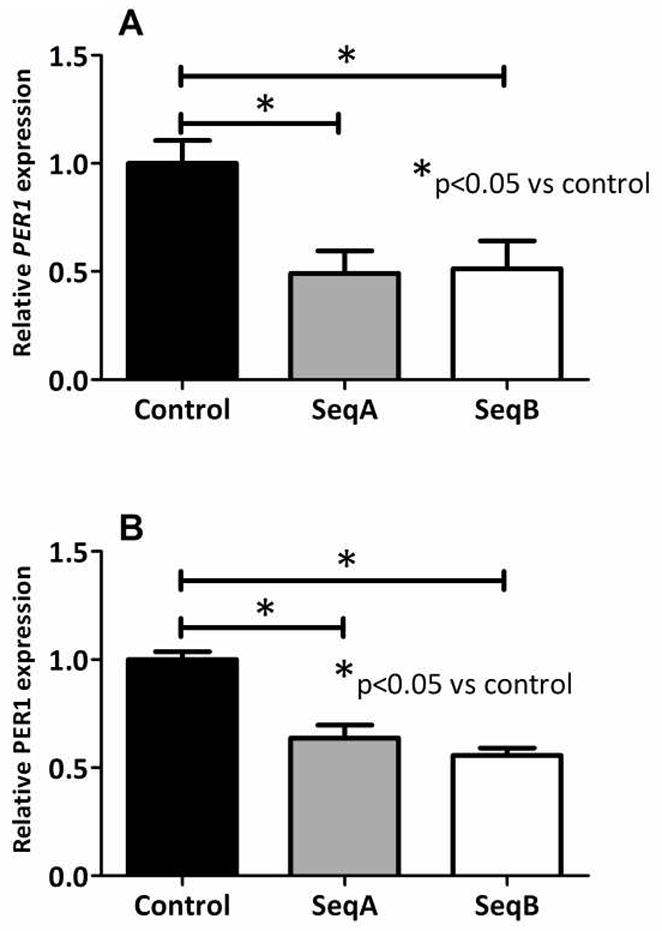
PER1 mRNA (A) and protein expression (B) in Caco-2 cells stably transfected with PER1 knockdown sequences vs the scrambled sequence negative control and harvested at 7 days post-confluence. mRNA expression was measured by qPCR and protein expression via Western blotting. Values are expressed as means ± SEM, normalized to actin and indexed to the negative control (n = 3 per group). Each experiment was performed a total of three times. Significance of variance between the three cell lines (SeqA, SeqB and control) was determined using ANOVA. Significant differences between each knockdown cell line and the control cell line were subsequently identified using post-hoc Tukey analysis.