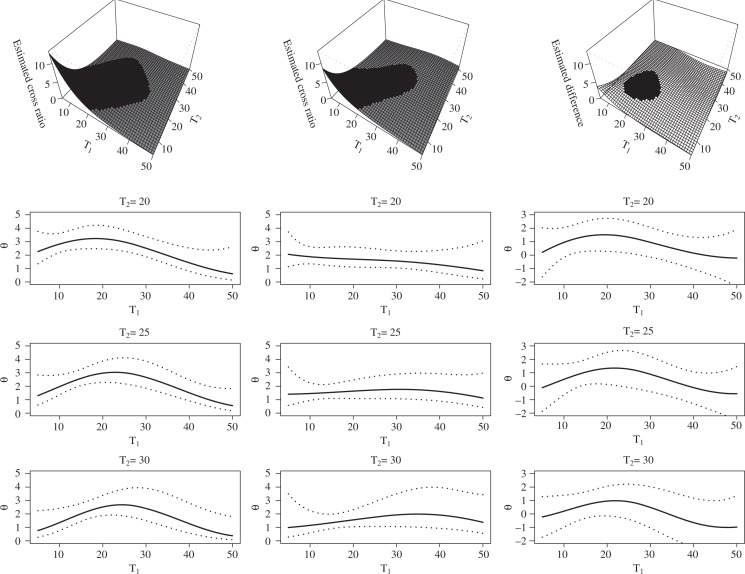
Fig. 2.
Estimated cross ratio function for the Australian Twin Study. Left panel: monozygotic twins, middle panel: dizygotic twins, and right panel: the difference between monozygotic twins and dizygotic twins. The shaded areas in the upper left and upper middle plots are regions where the association is statistically significant, and the shaded area in the upper right plot is the region where the difference in the strength of association is significant based on the pointwise confidence bands. In the lower panels, the solid lines represent the cross ratio estimates and dotted lines represent pointwise 95% confidence bands.

