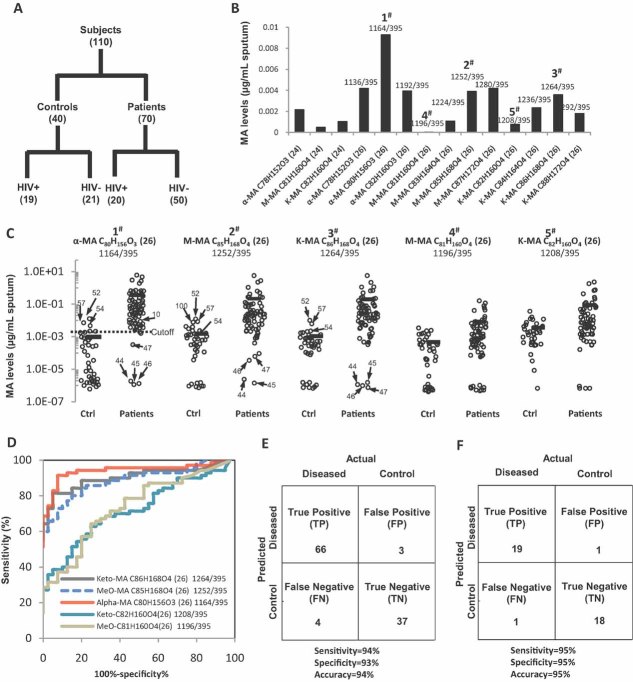
Figure 2. MAs in sputum are diagnostic for TB infection in humans.
- A. Diagram illustrating the case–control set-up and number of TB patients (n = 70) and non-TB controls (n = 40) analysed. Samples originated from four different countries (see Table S2 of Supporting information for detailed demographic information).
- B. Sputum samples (200–500 µl) were extracted using organic solvents and levels of individual MA molecular species were determined using MS in MRM mode. Major MA species for α-MA (alpha-), M- (methoxy-) and K- (keto-) MA with their respective molecular composition are plotted, with (24) and (26) indicating the number of carbon atoms in their respective alpha chain.
- C. Individual MA molecular species varied in their power to differentiate between non-TB controls and TB patients. Numbered dots highlighting false positive and false negative results correspond to patient IDs in Table S2 of Supporting information. Cutoff for MRM 1164/395 between non-TB control and patients is 0.0026 µg/ml sputum.
- D. ROC curve displaying the classifying performance (positive diagnostic likelihood ratio) of individual MA molecular species, expressed by its true positive rate (sensitivity) and false positive rate (1—specificity), with α-MA C80H156O3 providing the best accuracy.
- E,F. The predictive power of MA quantification is shown by confusion matrix for all 110 samples (E) and for the 39 HIV+ patients (F) alone. Sensitivity and specificity were calculated as described in the text.

