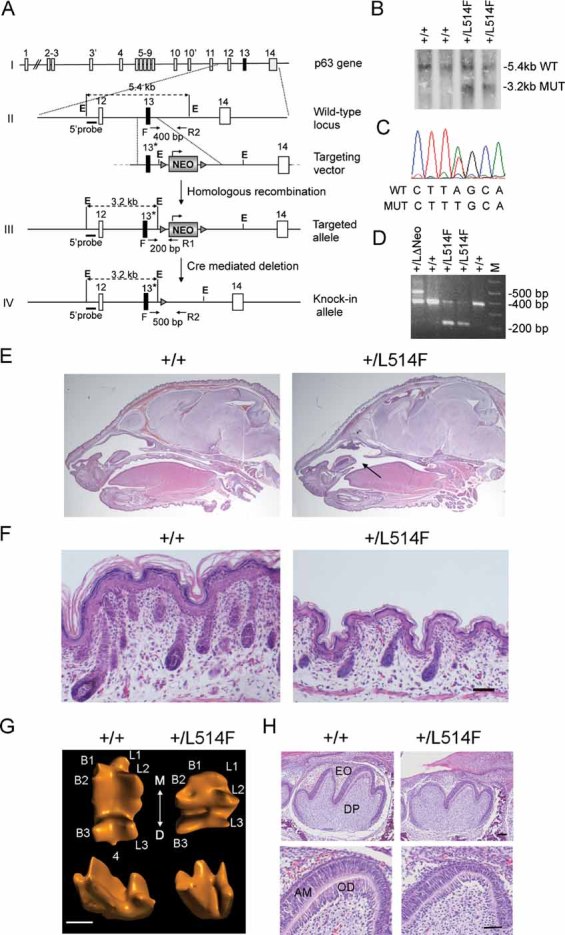
Gene targeting strategy used to generate the p63+/L514F knock-in mice. The L514F mutation is indicated with *. Dotted black lines indicate the sizes of the fragments generated from each allele upon EcoRI (E) digestion. Oligonucleotide primers (arrows) used for PCR analysis and the relative PCR product length, are indicated.
Southern blot analysis of ES cell clones using the EcoRI digestion of genomic DNA and the 5′ probe upstream of the recombinant targeted site.
DNA sequencing analysis of the L514F point mutation in properly targeted ES cells.
In vivo removal of the NEO cassette obtained by crossing chimeras with CMV-Cre transgenic mice, as revealed by PCR analysis performed on tail genomic DNA using one forward (F) and two reverse primers (R1 and R2).
H&E staining of sagittal sections of +/+ and p63+/L514F newborn heads. Cleft of the secondary palate is indicated by the arrow.
H&E staining of dorsal skin of p63+/L514F mice at P0. Mutant epidermis is thinner and with less developed hair follicles.
Three-dimensional computer-aided reconstruction of tooth crown morphology of the first lower molar at P0. The cusps are numbered as buccal (B1, 2, 3), lingual (L1, 2, 3) and distal (4). The axis of the tooth coming in contact with adjacent teeth is indicated: mesial (M) and distal (D). Scale bar: 400 µm.
Histological analysis of sagittal sections of the first lower molar at P0. EO, enamel organ; DP, dental papilla; AM, ameloblasts; OD, odontoblasts. Scale bar: upper panel 50 µm, lower panel 40 µm.