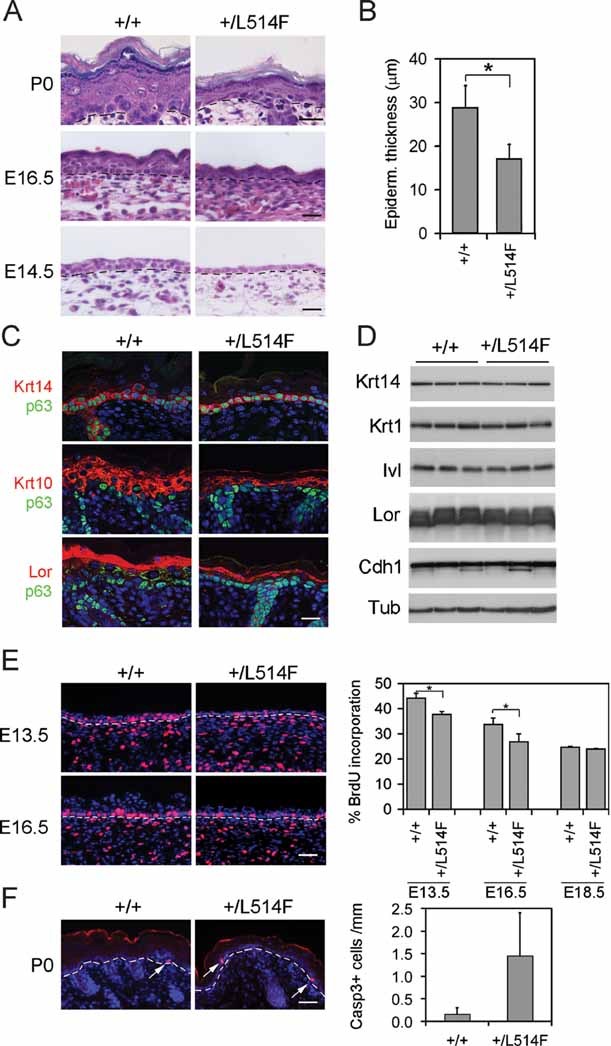
H&E staining reveals hypoplasia of p63+/L514F epidermis at the indicated times of development. Dashed lines indicate the border between epidermis (top) and dermis (bottom). Scale bar: 50 µm.
Quantification of epidermal thickness (µm) in +/+ and p63+/L514F skin at birth (*p-value = 0.0009; n = 6). Data are represented as mean ± SD.
Immunofluorescence analysis for p63, Krt14 (basal layer), Krt10 (spinous layer), and loricrin (Lor, granular layer) at P0 reveals appropriate expression of these differentiation markers in mutant epidermis. Scale bar: 20 µm.
Immunoblotting of total cell extracts from neonatal epidermis using antibodies against the indicated differentiation markers, Krt1 (spinous layer), the upper spinous layer marker involucrin (Ivl), the adherens junction component E-cadherin (Cdh1) and αTubulin (Tub) as loading control.
BrdU staining of the epidermis reveals reduced proliferation in mutant epidermis during development. Left panels: BrdU positive cells are in red; nuclei are stained with DAPI. Dashed lines indicate the border between epidermis (top) and dermis (bottom). Scale bar: 50 µm. Right panel: BrdU positive cells are expressed as percentage of the total number of basal cells (E13.5 *p-value = 0.0151; n = 7. E16.5 *p-value = 0.0271; n = 7). Data are represented as mean ± SD.
Left panel: immunofluorescence for active caspase 3 at P0 showing low levels of apoptosis in p63+/L514F epidermis compared to wild-type. Arrows indicate apoptotic cells. Scale bar: 70 µm. Right panel: quantification of active caspase 3 positive cells. Data are represented as mean ± SD (p-value = 0.0010; n = 16).