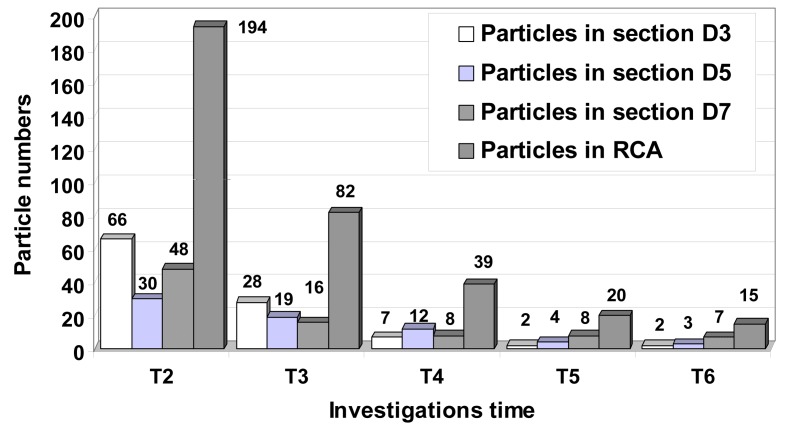
Figure 10.
Particle distribution inside to the stenosed RCA during the cardiac cycle. Instantaneous plot of the particle distributions for different time steps in downstream sections of the stenosis ST1, ST2 and ST3. At the end of the cardiac cycle a number of 15 particles (1063 seeded initially at the time T = 0 s) remain inside of the RCA. A number of 7 particles remain in vortical flow patterns result in downstream section of the more sever stenosis ST3.

