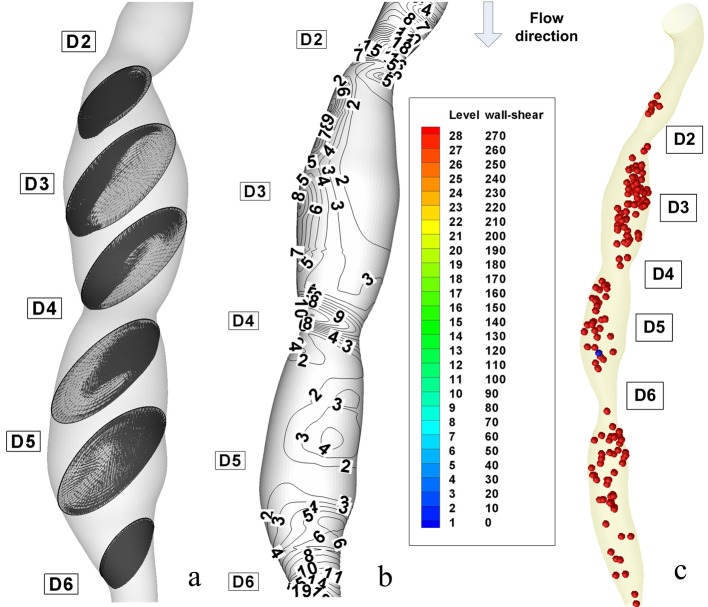
Figure 7.
Disturbed flow indicators and computational particle deposition patterns at the peak systole T2 = 0.26 s. (a) cross-sectional transient velocity vector fields; (b) temporal WSS magnitude contours in stenosis ST1 and ST2 (WSS value are in (PA)); (c) particle transport and deposition in the stenosed RCA geometry at the time T2.

