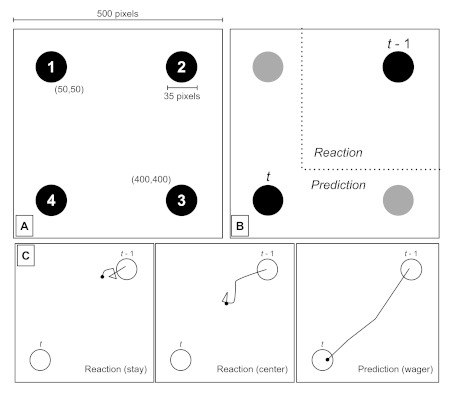
Figure 1.
Panel A. Stimuli locations on computer screen. Panel B. Example region for reactive and predictive movements when mouse position is recorded after disappearance of stimulus t-1 and at the onset of stimulus t (750 ms lapsed). Panel C. Hypothetical trajectory examples for illustration of predictive/reactive categories during the 750-ms inter-stimulus interval. (Note that open circles reflect no stimuli on the screen, but indicate stimulus t and t-1.)

