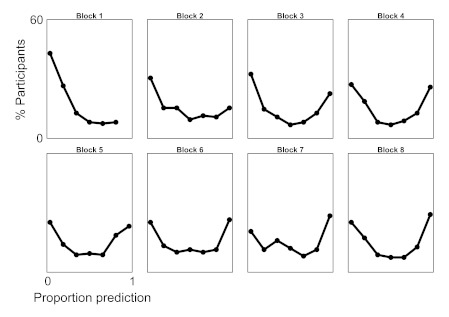
Figure 3.
The percentage of participants (from all 11 G-score sequences) that exhibit reactive (proportion prediction = 0) or predictive (proportion prediction = 1) response modes across 48-position sequences divided into eight blocks. (Note that Block 1 shows 6 bins because Block 7 contained no participants. This 0 was included in the analysis, however.)

