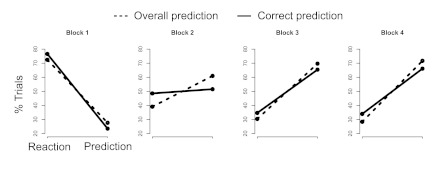
Figure 4.
The distribution of trials in correct predictions (black line) and any predictive movement at all (dotted line). As seen in Block 2, overall prediction represents a larger proportion of the trials (approximately 70%) than correct prediction by itself (50%). In other blocks, prediction and correct prediction overlap closely.

