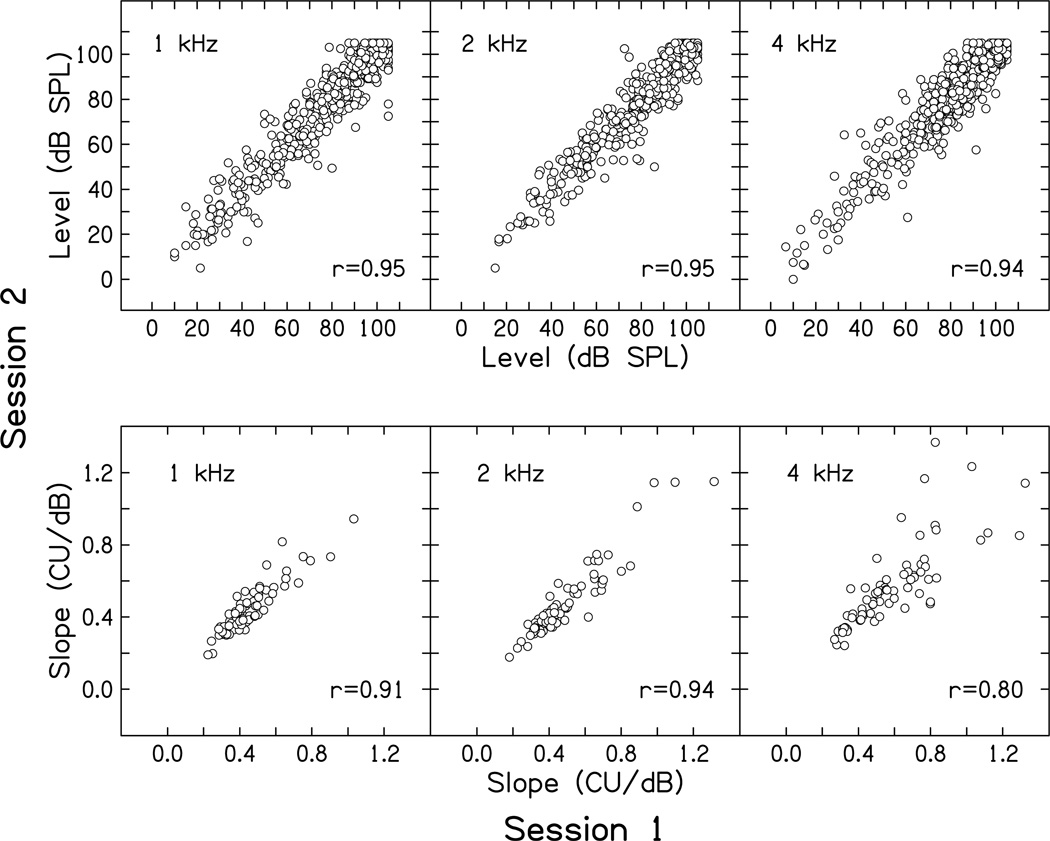
Figures 2a and 2b.
Figure 2a (top) plots the mean stimulus level from the three trials in session 2 as a function of the mean stimulus level for the three trials from session 1. Each data point represents levels for every individual category used by each subject during CLS measurements. Figure 2b (bottom) plots the slope (CU/dB) of a simple regression line fit to all of the data from each subject’s entire CLS function from session 2 as a function of the slope of the function fit to the comparable set of individual data from session 1. In both figures, data for each frequency are provided separately in each panel and correlations are provided as insets in each panel. Data from normal-hearing and hearing-impaired subjects are combined within each panel.

