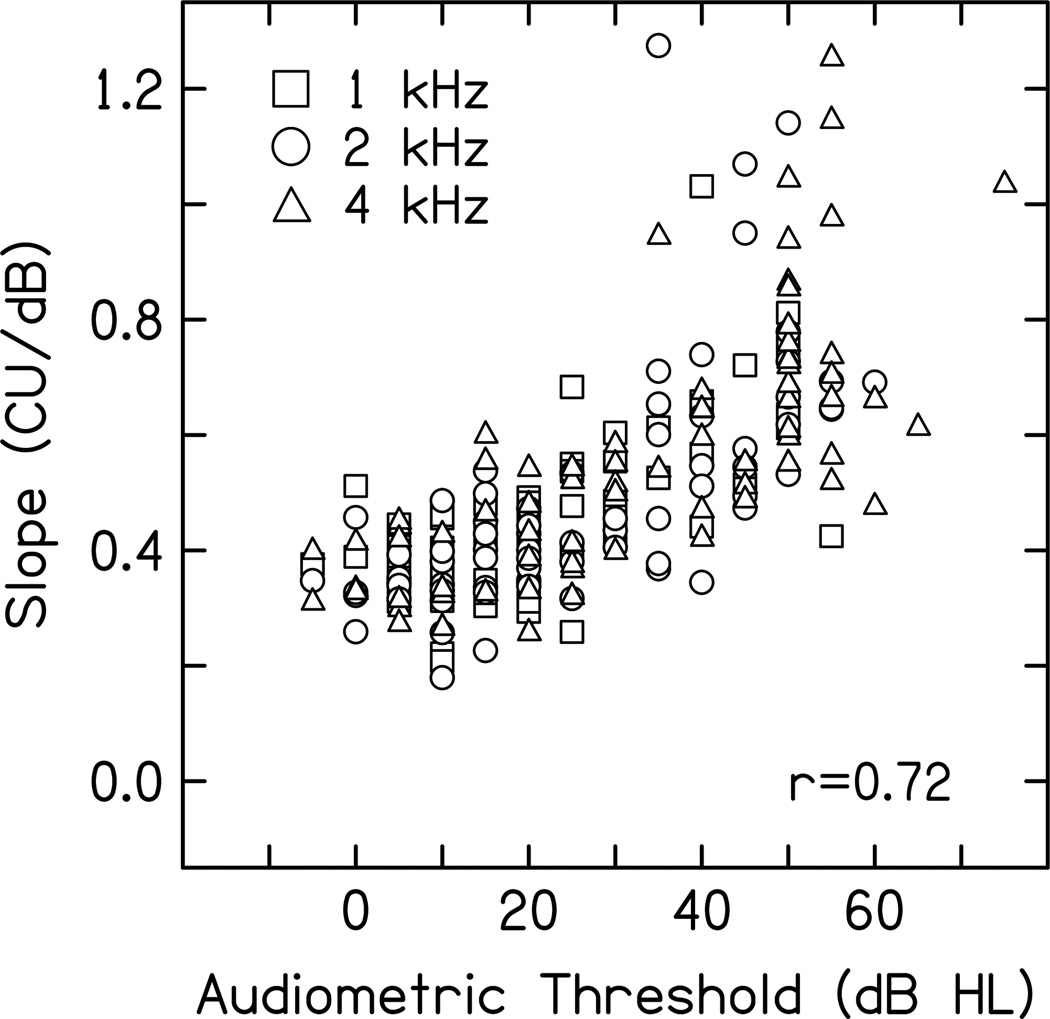
Figure 3.
Slope (CU/dB) of a straight line fit to the entire CLS function for each subject is plotted as a function of audiometric threshold, following the convention used by Launer (1995). Data for different frequencies are represented by different symbols: squares – 1 kHz; circles – 2 kHz; triangles – 4 kHz. The correlation provided within the figure was determined by collapsing across frequency.

