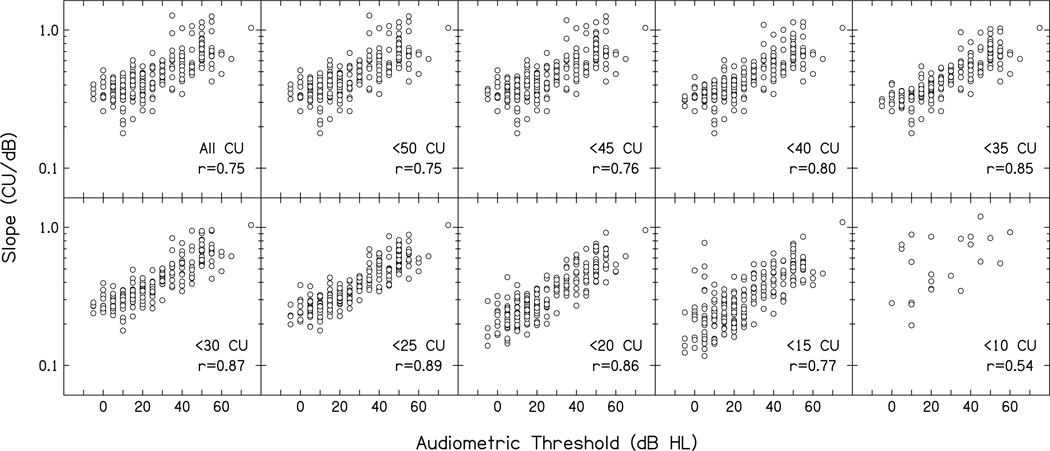
Figure 4.
Slope (CU/dB) of a line fit to decreasing ranges of categories from averaged individual loudness functions are shown as a function of audiometric threshold. The slopes associated with each range of categories are plotted in separate panels, going from the most inclusive to the least inclusive range (upper left panel and lower right panel, respectively). Within each panel, data are shown for all three frequencies. Correlations are provided as insets within each panel.

